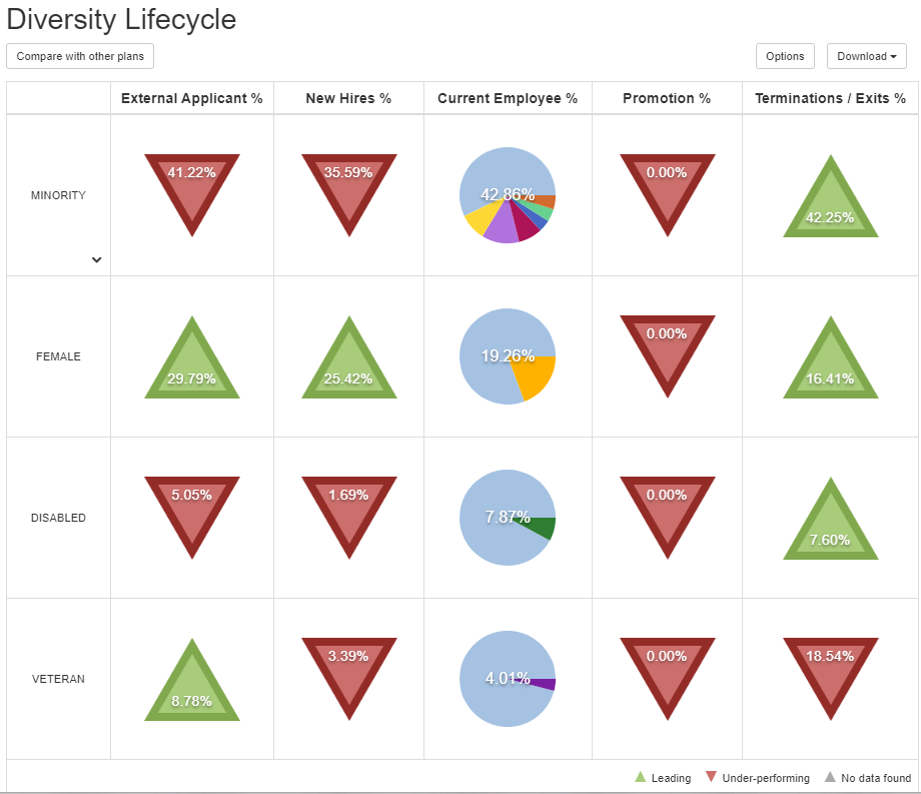
Ready to move the needle? The Diversity Lifecycle helps you target where you’ll get the most traction in your diversity efforts. By distilling a variety of information, you will know exactly which areas need special attention.
Incoming talent is compared to your employee demographics.
Employee representation is displayed in the center column giving a quick view of each group’s representation.
Promotions – quickly asses whether promotions are equitable throughout the organization.
Exits – are you losing diversity through turnover?
Each indicator can be clicked to reveal additional details and interpretation. Detailed race/ethnicity displays can also be shown.
Additionally, this report can be used to look at aggregate or granular metrics. Allowing your team to know where to focus by looking at the entire organization, operating companies, business units or departments.
How does your team stack up?
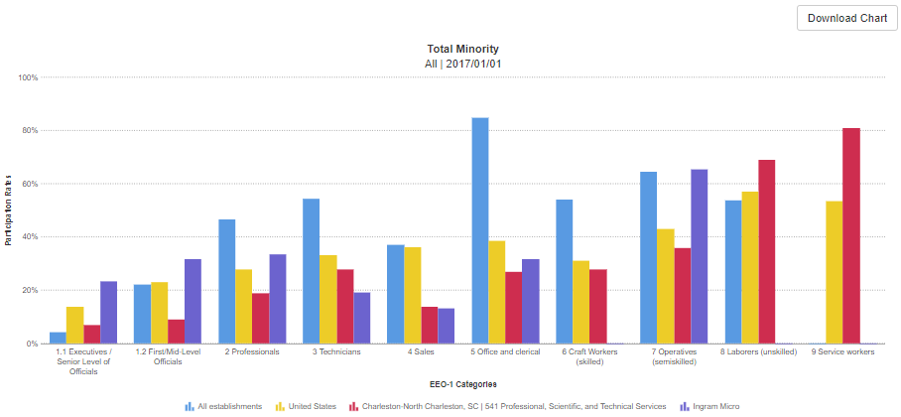
Our EEO-1 benchmarking tool is a flexible reporting engine that lets you compare your organization to a variety of external benchmarks. Compare your team to others in your industry, geography, even to specific companies*, or any combination of those factors. This tool allows for immediate access to the most relevant and timely data for your business
Are you growing in diversity?
The Talent Pipeline Analysis allows you to compare applicant pool and new hire demographics along with your current employee populations. This report identifies any bottlenecks to increasing the diversity of your team. By viewing these metrics side by side, you’ll discover if you need better outreach efforts or if there is a selection process issue. This analysis is available at the job category and organizational unit levels


